Introduction
JITWatch is a log analyser that visualises the Java JIT compiler’s decisions.
Java code compiles to bytecode in the first instance. Then on execution, the Java VM profiles the executed methods, identifying heavily used methods and compiling them to machine code. JITWatch is a valuable tool in determining whether the JIT compiler is optimising the running code, and spotting issues where the code isn’t being optimised, as expected by the developer.
Installation
The JITWatch source can be downloaded from here: https://github.com/AdoptOpenJDK/jitwatch The project supports gradle build, in the project directory (on Windows):
gradlew.bat clean build run
To generate the hotspot.log, add the following VM arguments to the application:
-XX:+UnlockDiagnosticVMOptions-XX:+TraceClassLoading-XX:+LogCompilation-XX:+PrintAssembly
The application will generate a file in the format: hotspot_pid12345.log, where 12345 is a sample pid.
hsdis
Hsdis is a disassembler library which is used by JITWatch, for licensing reasons it isn’t part of the JDK. The library needs to be built and placed in the JDK’s directory. Instructions for building on Windows:
https://dropzone.nfshost.com/hsdis/
Tour
Config
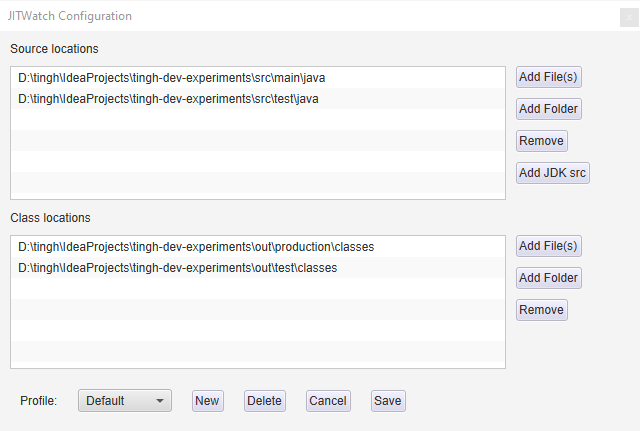
Before opening the log, click the Config button. In the Configuration window, add the application’s source location and class locations:
Package Explorer
The package explorer shows the classes that were executed by the application.
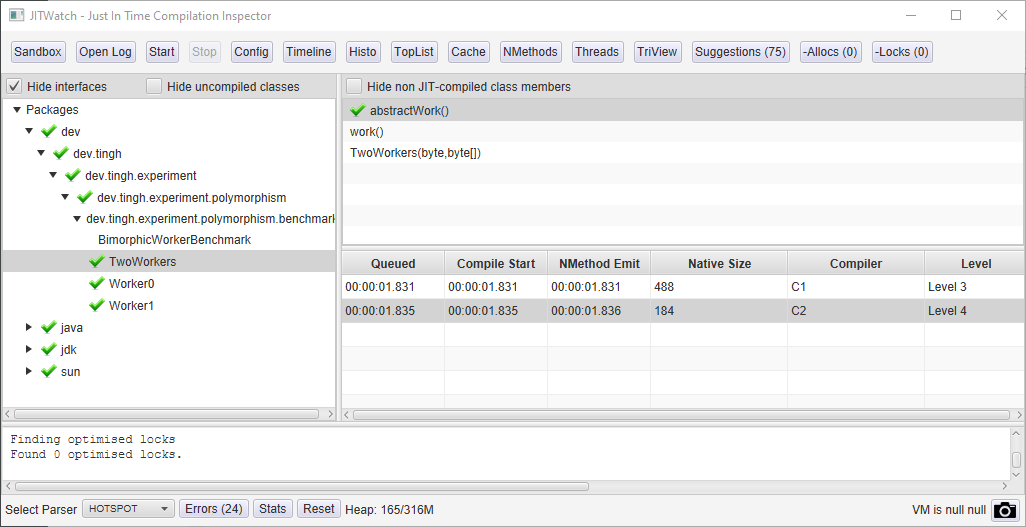
More importantly, it shows those packages and classes that contain methods that have been JIT-compiled. For a JIT-compiled method, JITWatch will show which compiler compiled the method, i.e. C1 or C2.
Compilations Timeline
The Compilations Timeline shows the number of compilations over time.
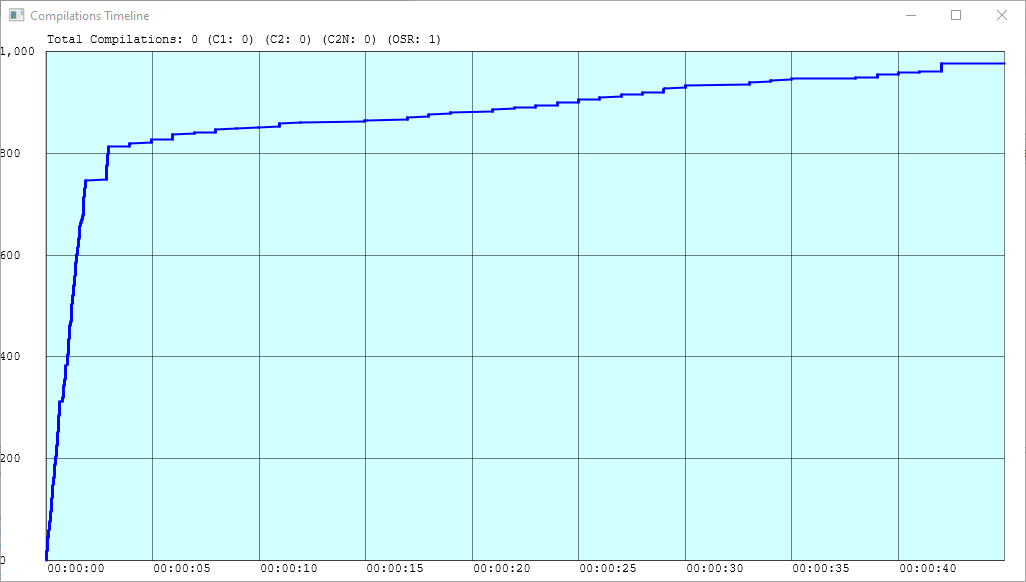
This information is valuable if the application has a warm-up phase and if the application expects the bulk of compilation in this warm-up phase. The timeline can be used to spot compilation spikes while the application is running, which need to be moved to the warm-up phase.
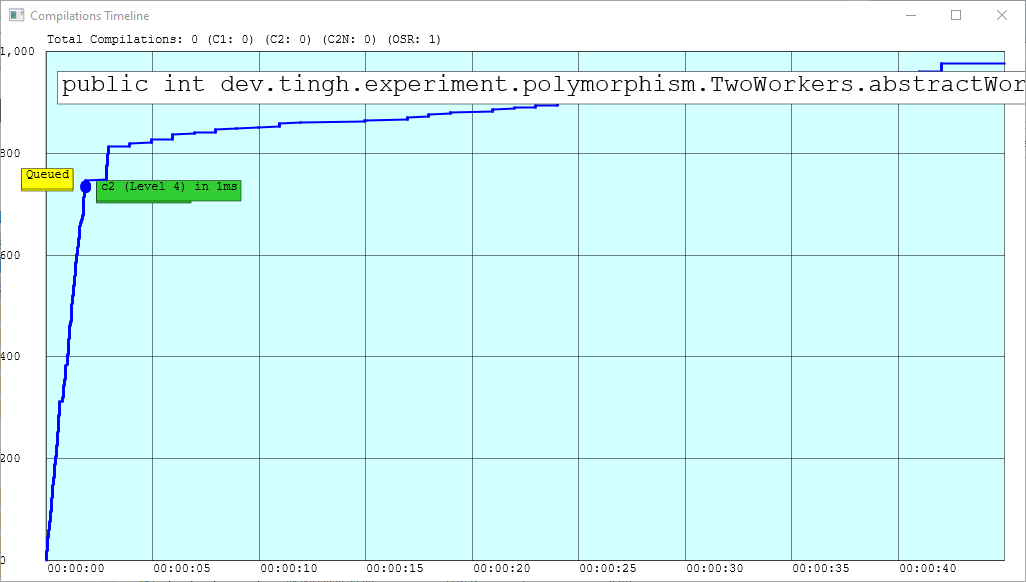
Upon selecting a method the timeline shows when a method compilation occurs, and which compiler did this, i.e. C1 or C2. This is important if the application needs to be warmed up, the compilation timeline ensures that ‘hot’ method compilations occurs as part of warm-up.
TriView
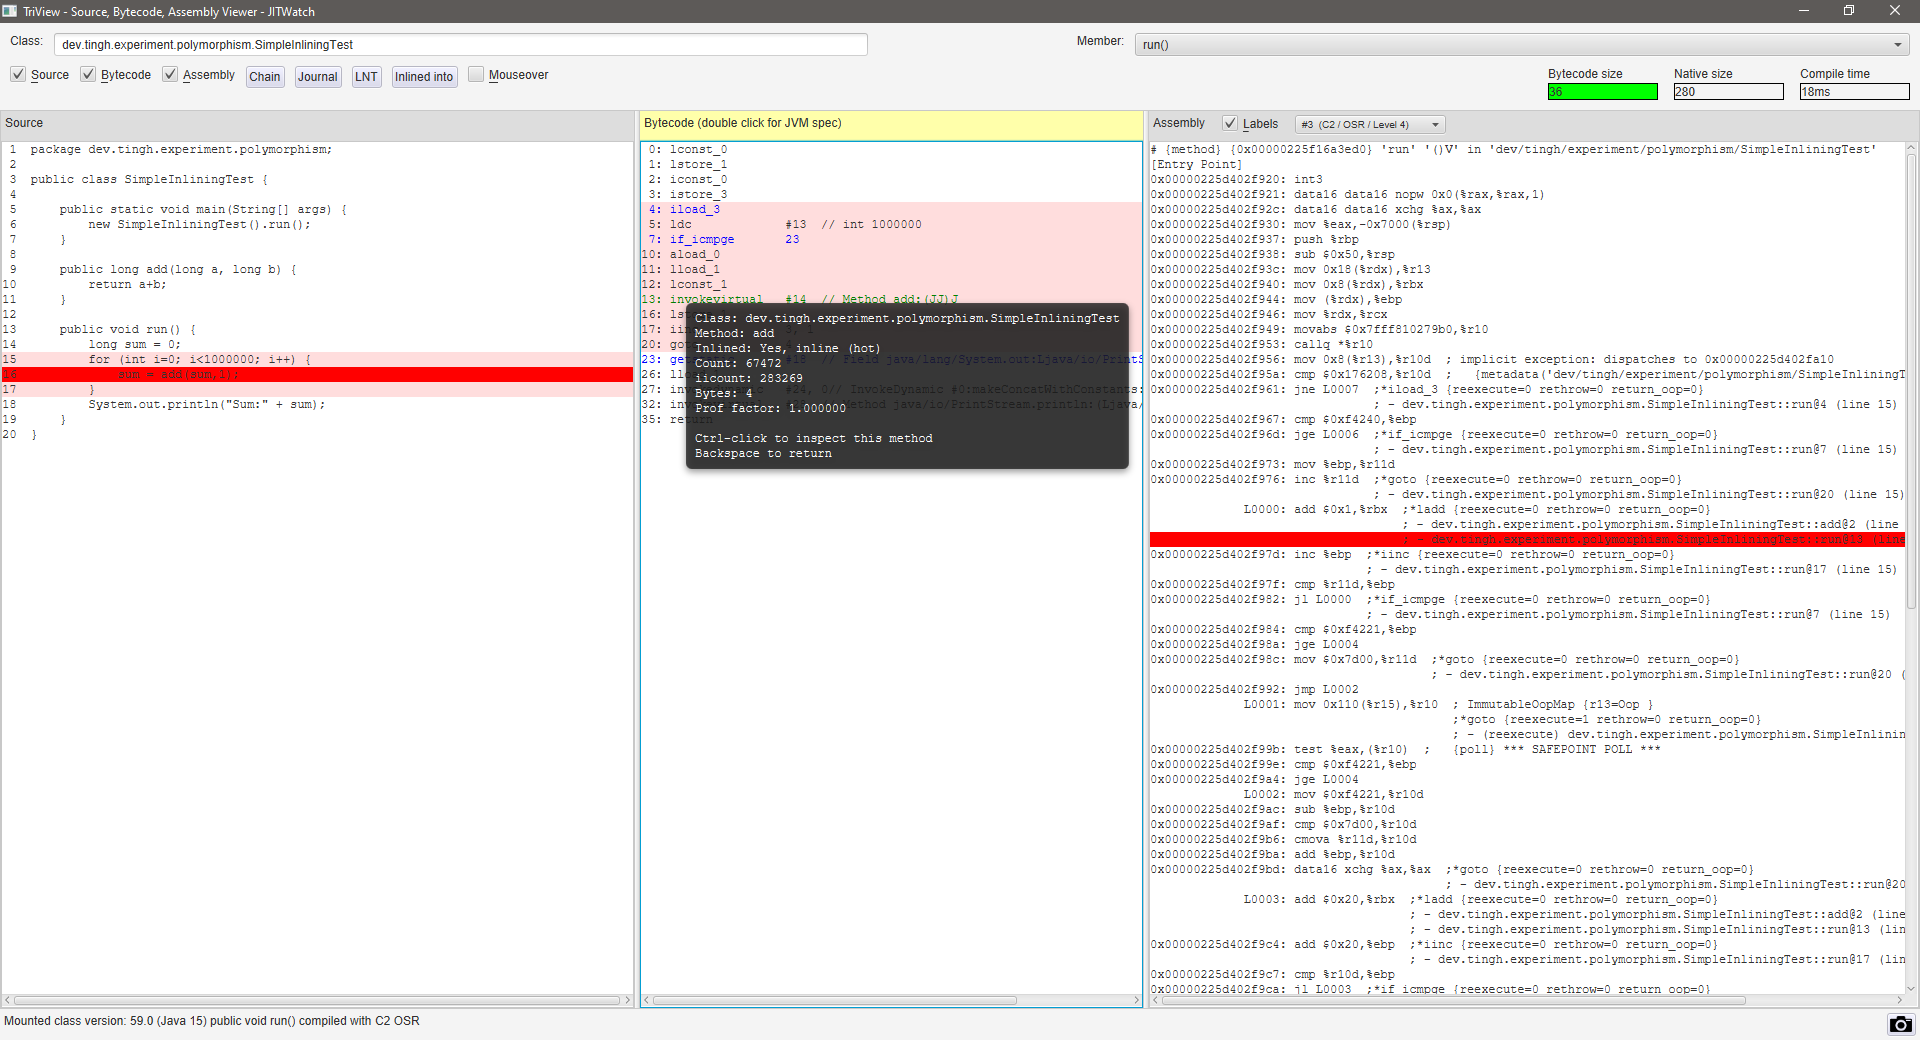
The TriView shows three panes with the Java source, the bytecode and the compiled assembly code. This view can highlight how the compiler has compiled the code.

The TriView will show in-lined (hot) lines of code.
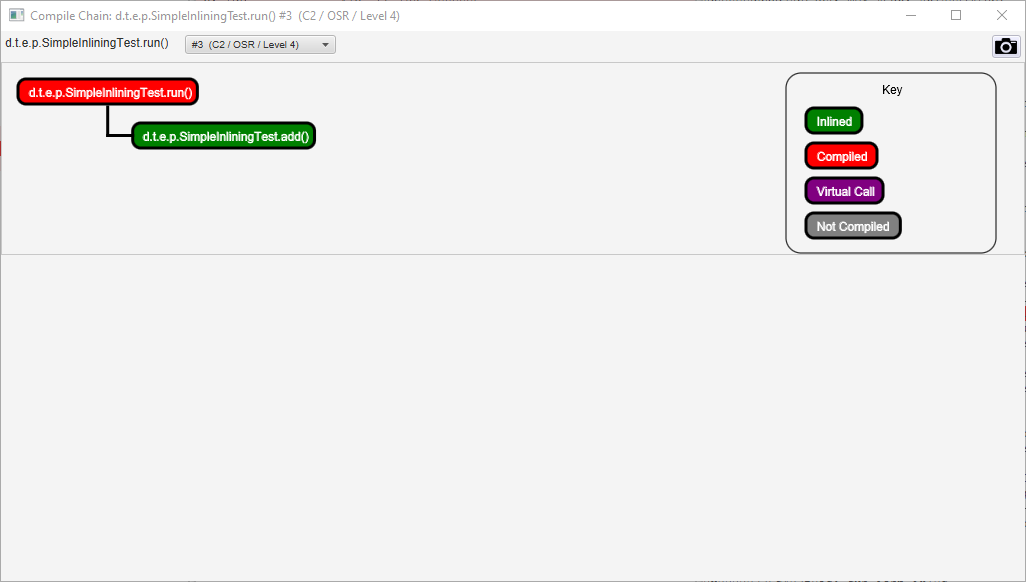
Also, to support this, there is a ‘Compile Chain’ view that will show compiled methods, along with in-lined methods.
Closing
JITWatch can easily provide useful insights into an application, in terms of an application’s code compilation. It can provide valuable feedback, if an application has a warm-up phase, JITWatch can help identify the effectiveness of a warm-up phase and unexpected performance profiles during execution of low-latency applications.
There are other interesting views not discussed, the sandbox, the code cache and suggestions/recommendations, something for later perhaps.